Traxim
The heart of Traxim is the resolver engine. As a fast and effective tool to deconflict train paths, Traxim can be used to support all short, medium and long term network planning tasks. Automation with Traxim delivers better decision making at lower cost.
Generate the data required for meaningful what-if analysis of complex rail networks.
Rapidly make master timetables with full wrapping around the end of the week.
Rework the master timetable with daily cancellations, ad hoc additions, and temporary speed restrictions.
Provide real time recommendations to train controllers, and project train arrival times for customers.
Traxim is a suite of fully online tools. Use of Traxim is free while in beta testing mode. Go to the Tools page to access the online apps. Or use the Getting Started page to get started. Sample input files and use case descriptions are available on the Resources page.
Dynamically simulated train paths across a rail network infrastructure defined at the level of track geometry, signals, turnouts and speedboards.
A fully deconflicted train timetable applying absolute and relative train priority, train linking, routing & stopping rules, and simulated acceleration and deceleration for conflict resolution, with optional week-end wrapping.
Traxim was first conceived as a tool to efficiently generate a population of semi-randomised timetables so that analysis of network performance could be done with statistical rigour.
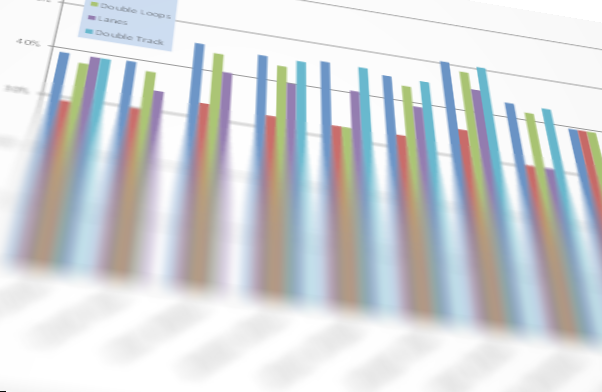
Track utilisation rates generated consistent with UIC 406.
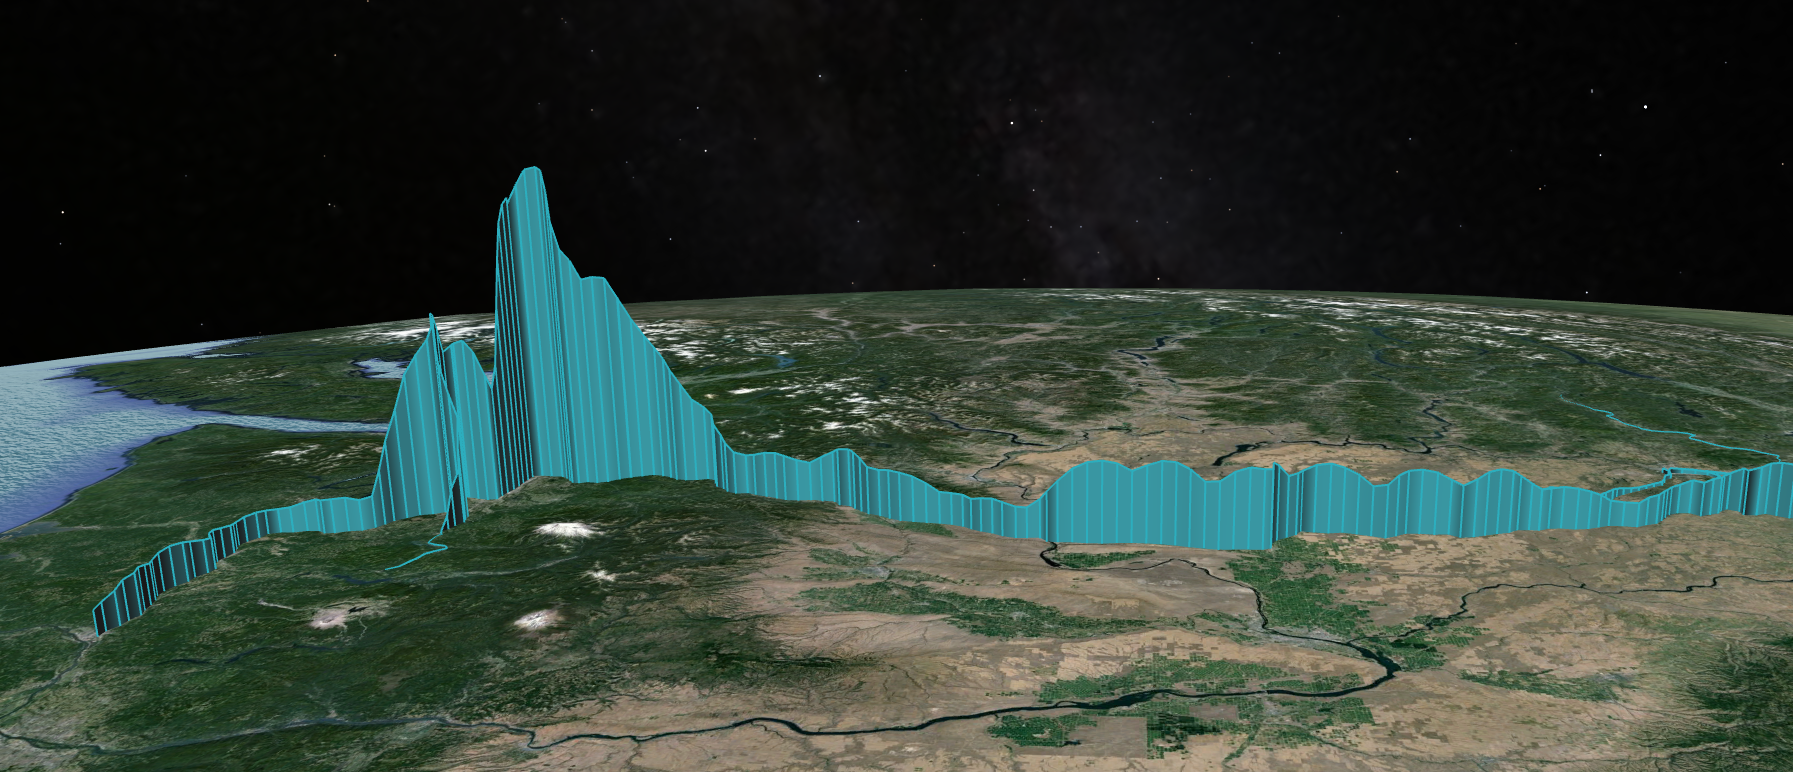
Congestion data by location exported to Google Earth for intuitive, visual display.
Transit time for every train, and averages for groups of trains, at your fingertips. Raw dynamically simulated transit time, planned dwell and conflict induced dwell each separately reported.
All the data you need to be able to compare infrastructure and non-infrastructure solutions to congestion and transit time challenges.
Traxim automates the master and daily timetabling function.
All relevant inputs are managed in two simple spreadsheets.
Timetable wrapping can be on or off. Traxim can wrap after any specified number of days.
Trains can be linked to ensure departure of one train isn't until after a previous arrival. Linking one to many, and many to one, is both possible.
Trains can be forced to pass through, or not pass through, defined nodes. Dwell can be enforced as both a minimum dwell time, and a not-before departure time.
Priority is used to favour one train over another in a conflict. It can be both absolute, and relative. Relative priority uses an unbounded value, allowing unlimited granularity in prioritisation.
Traxim offers a bespoke solution to live run movement planning.
Traxim recommends efficient and valid crossing decisions, allowing train controllers to focus on other tasks.
Traxim will resolve a timetable until all live trains reach their destination. Customers and operations staff know exactly when to expect a train.
Traxim will refresh every two minutes using the most current train location data. Decisions are made with the best available information.
An emulation of a sample network is normally running live using randomly simulated variation. Go to the Traxim Train Plan Viewer. Select the file with ''live" in its name from the top-right dropdown. Click the "Live" button. Select regions, their order, and direction from the regions sidebar. Enjoy.
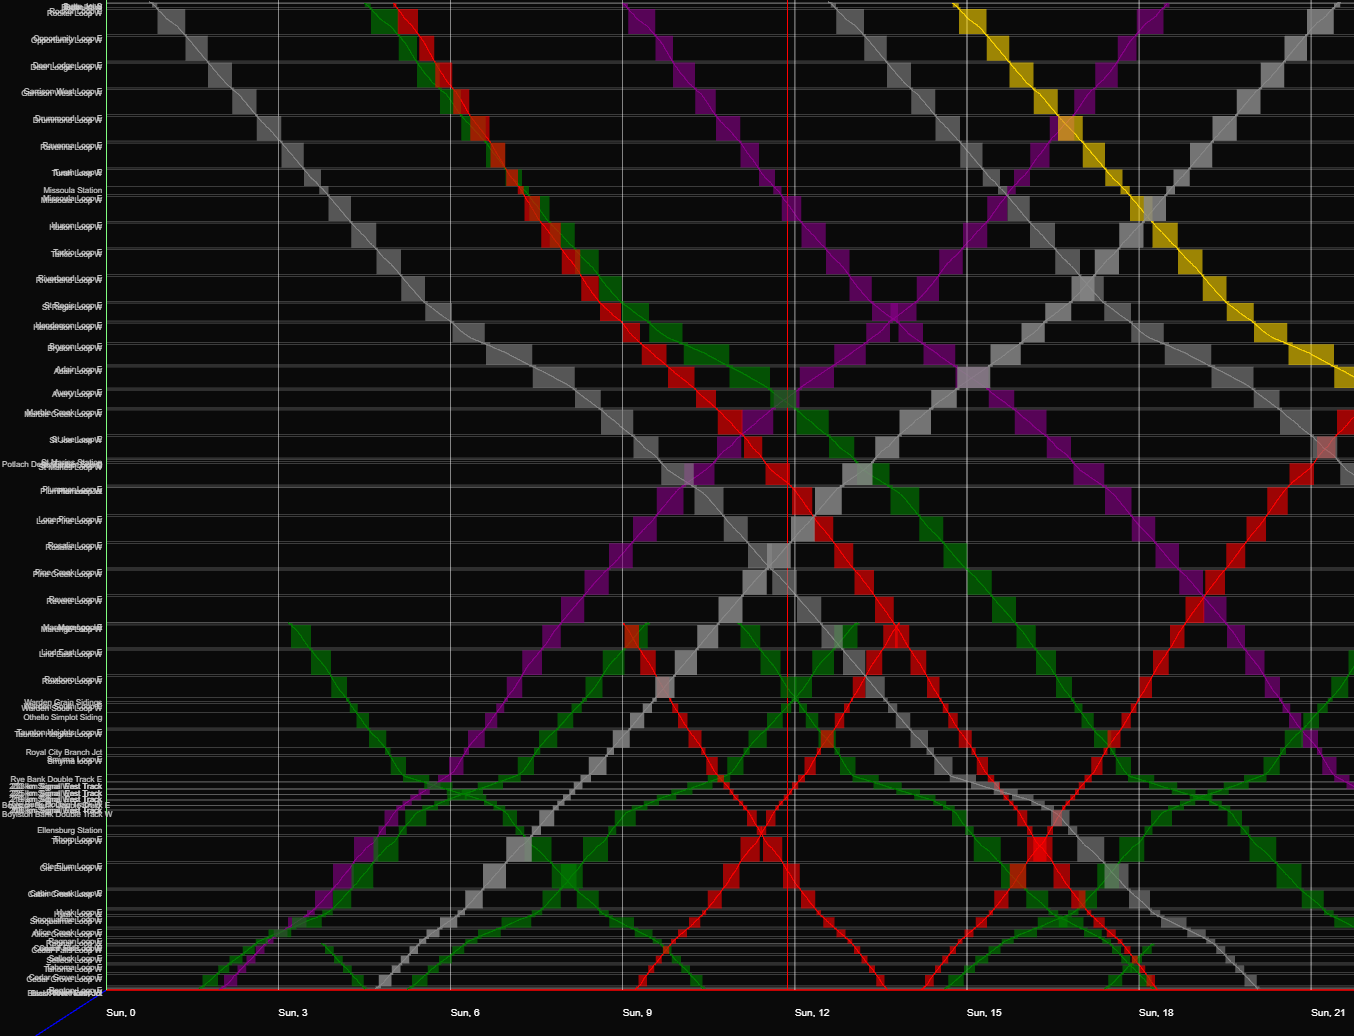
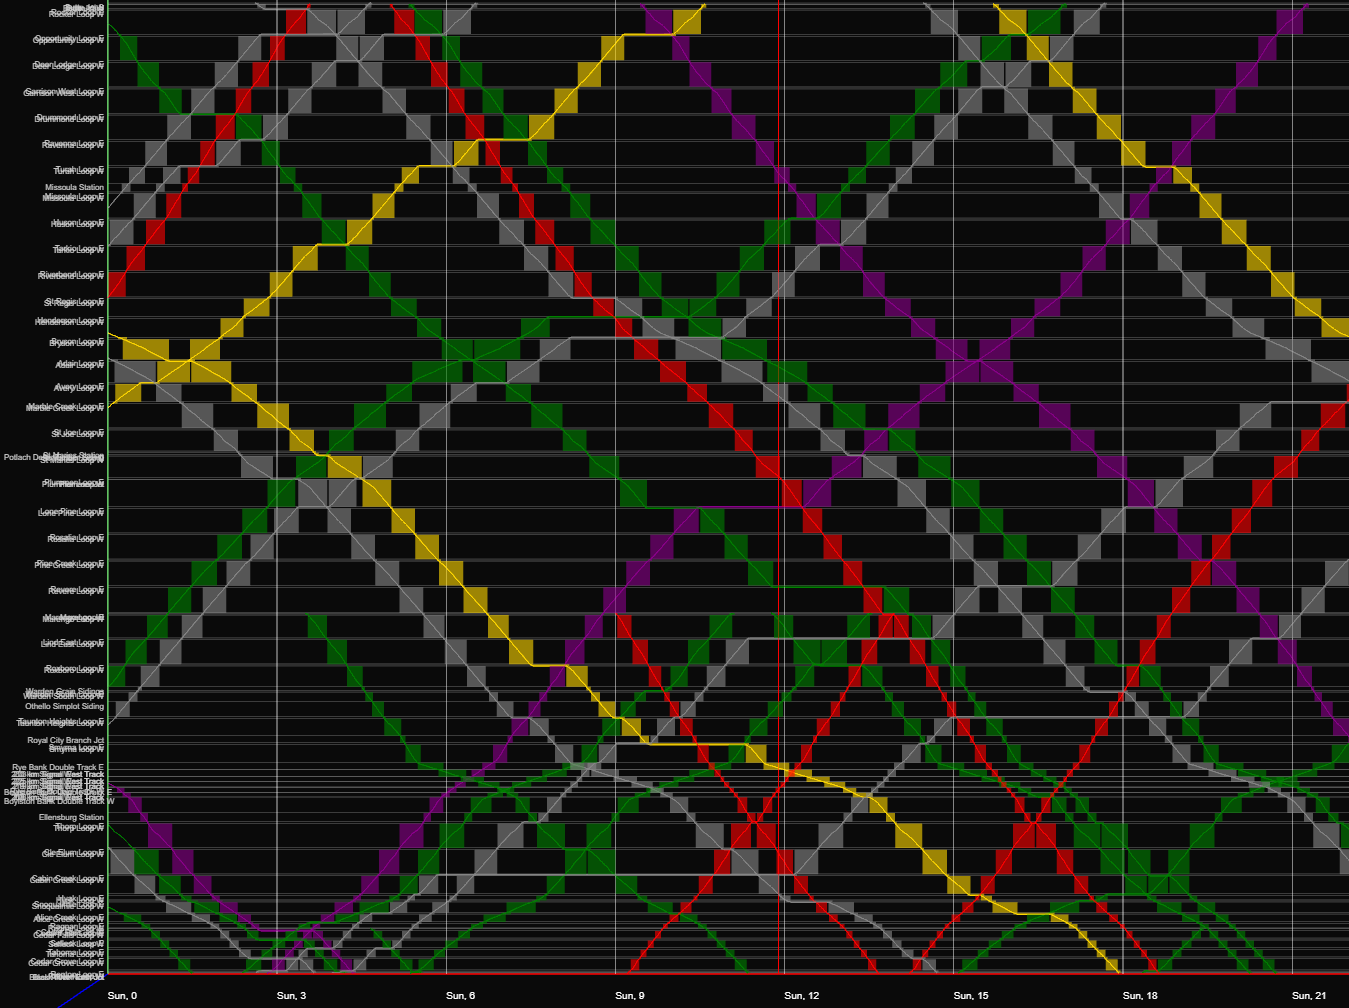
A train graph (or stringline) can be viewed in the Traxim Train Plan Viewer. The Train Graph includes full blocking information. It can also be downloaded as a pdf.
A kml file showing delay by location can be generated for one, or an average of all, timetables in a scenario. Open the kml file in Google Earth Pro to get an immediate visual analysis of where the greatest congestion on the network is. Multiple kml's can be opened to allow a visual comparison of competing solutions to network challenges.
A wide array of data for a single or population of timetables can be downloaded as csv files. Data is reported by train group and region. All of the data is easily manipulated in Excel, allowing extensive analysis and visualisation of results.
Traxim is a passion project 14 years in the making. We created Traxim to solve a nagging problem in analysis of rail networks - how can you be confident that your rail network development solutions will really work on a complex network with non-homogenous trains. Driven by a need to get statistical robustness into our analysis while minimising the time and effort involved, we built Traxim to generate a population of realistic semi-randomised timetables using the minimum viable input scope. We believe strongly in the Traxim product, and have now brought it to the public while expanding the range of uses it can be efficiently deployed to.